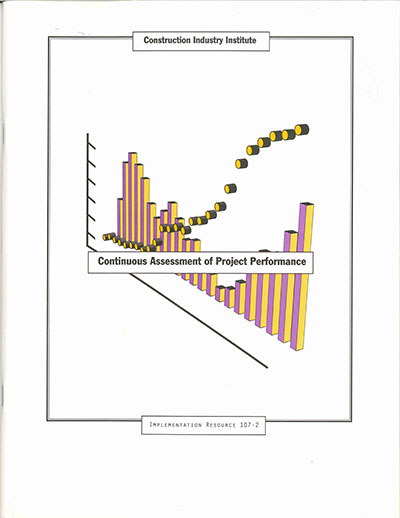
Continuous Assessment of Project Performance
All project participants need information to assist them in managing projects. This book describes a process whereby owner, engineer, and construction contractor organizations can use continuous variables (e.g., owner expenditures and construction effort-hours expended) to predict project outcomes from start of detailed design through construction completion.
S-curves were developed for two project outcome categories: (1) “successful” (meeting or exceeding budget and schedule expectations of the owner) and (2) “less-than-successful” (not meeting budget and/or schedule expectations of the owner). Statistical analysis was performed to identify those variables showing a statistically significant difference between the two project outcome categories at any point in time. Variables exhibiting such a difference can be used as predictors of project outcome. Results show that different variables are predictors of success at different points of time during the project lifecycle.
A total of 54 completed projects (45 successful and nine less-than-successful) were provided by 17 CII companies. Considering the range of project characteristics, limited data are contained in the database. Thus, organizations using this tool will need to augment the existing data with their own data.
Due to the amount and complexity of the data collected, a computer program was developed to assist in the analysis process. The 2.0 version of this program, Continuous Assessment of Project Performance (CAPP), runs on a Microsoft Windows platform. The software consists of four modules: (1) data input, (2) data normalization, (3) statistical analysis, and (4) graphical report generation.
CAPP provides a user-friendly, icon-driven data input screen. This feature allows users to add new project data into the database. The data normalization module converts time chronologically on the horizontal axis, and converts the selected variable cumulatively on the vertical axis. The statistical analysis portion analyzes the significance of the difference between the two project outcome categories for each variable and identifies when a variable is a predictor of project outcome. CAPP can accommodate multiple continuous variables simultaneously for real-time control, and can show the relationships of a continuous variable among the different phases of the project.
The graphical module generates the S-curves for the successful and less-than successful projects. The software provides the flexibility to analyze data from different perspectives: (1) project type (e.g., process plant, manufacturing, and general building), (2) project size, (3) organization type (e.g., owner, contractor, and designer), and (4) contract strategy for designer and constructor (e.g., lump sum and reimbursable cost). CAPP provides the framework to collect data for benchmarking purposes as well as provides an aid in pre-project planning.
The software consists of four modules: 1) data input, 2) data normalization, 3) statistical analysis, and 4) graphical report generation. The graphical module generates the S-curves for the successful and less-than successful projects. The software provides the flexibility to analyze data from different perspectives:
- Project type (e.g., process plant, manufacturing, and general building)
- Project size
- Organization type (e.g., owner, contractor, and designer)
- Contract strategy for designer and constructor (e.g., lump sum and reimbursable cost)
CAPP provides the framework to collect data for benchmarking purposes as well as provides an aid in pre-project planning. (IR107-2, p. vii)
Below is a sample CAPP output curve for the variable “Actual Owner Expenditures” for a project whose input parameters included: 1) a process plant construction type, 2) a reimbursable designer contract type, 3) a lump-sum construction contractor contract type, and 4) project size less than $900 million.
IR107-2, Continuous Assessment of Project Performance
This resource describes a process whereby owner, engineer and construction contractor organizations can use continuous variables to predict project outcomes from start of detailed design through construction completion. S-curves were developed for two project outrcome categories:
- Successful projects, meeting or exceeding budget and schedule expectations
- Less-than-successful projects, not meeting budget or schedule expectations
This publication has been archived because its associated software is no longer supported.